The Frequency of Scale

A Lateral Walk Through Live Data — March 30, 2026 · 12 steps · Sun → Earth → Atmosphere → Crust → Street · SOHO · GOES · Himawari · DSCOVR · Blitzortung · IRIS · Locustream · Windy
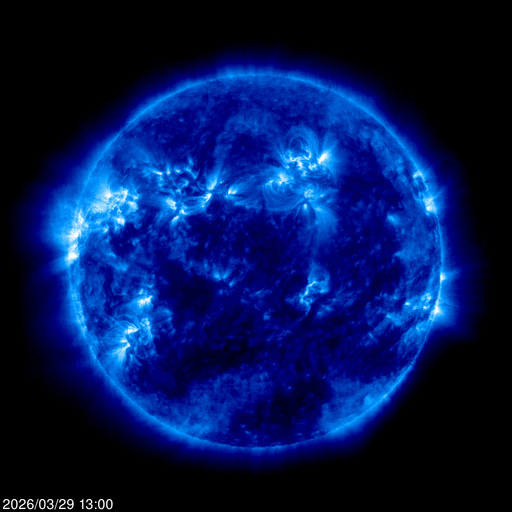
STEP 01 · SOHO EIT 171 Å · EXTREME ULTRAVIOLET · SOLAR CORONA · 2026/03/29 13:00 UTC
SOHO EIT 171 Angstrom image of the sun's corona in extreme ultraviolet, false-color blue, bright coronal loops and active regions

The sun at 171 angstroms. False-color blue, which is an editorial choice — this wavelength is invisible to us. What we're seeing is million-degree plasma traced by iron ions in the corona. The bright loops on the limb are magnetic field lines made visible by the matter trapped inside them. Architecture made of force.

There is no surface here. What looks like a sphere is actually a series of nested atmospheres, each hotter than the last — a violation of thermodynamic intuition that physicists still argue about. The corona is hundreds of times hotter than the photosphere below it. The outermost layer burns brightest. The skin is hotter than the body.

Observe: Magnetic loops on the sun's limb — bright arcs of trapped plasma curving back down to the surface
Remind: The St. Louis Gateway Arch — a catenary curve that looks parabolic but isn't. Things that curve back to where they started but aren't circles
Metaphor: Coronal loops are bridges to nowhere — they launch plasma into space, then pull it back. The structure exists to contain an impulse that would otherwise escape forever
Idea: There are two kinds of structures: ones that go somewhere (roads, pipes, arguments) and ones that contain energy by returning it to its source (loops, rituals, habits). The sun is mostly the second kind. Maybe everything that sustains itself is.
A star is a system of containment, not expression. Those coronal loops aren't the sun reaching out — they're the sun holding itself in. The bright edges are where the holding almost fails. Beauty is containment under strain.
Looking for containment structures at every scale — what holds, what almost fails, and whether the near-failure is where the beauty lives
+thread: containment-as-beauty · +thread: invisible-made-visible (false color as editorial) · +seed: the skin hotter than the body
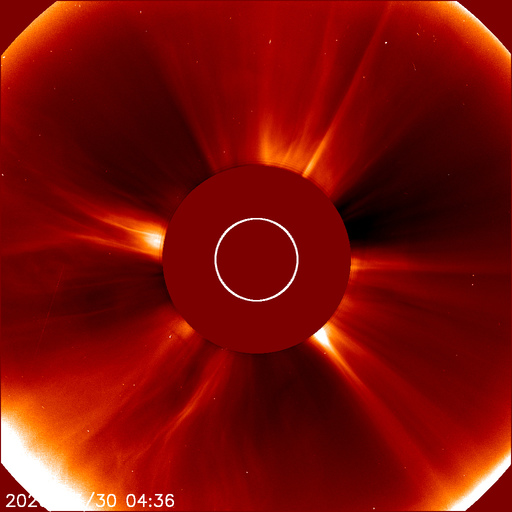
STEP 02 · SOHO LASCO C2 CORONAGRAPH · VISIBLE LIGHT · SOLAR WIND · 2026/03/30 04:36 UTC
SOHO LASCO C2 coronagraph showing solar corona streamers radiating outward, occulting disk blocking the sun's surface, bright CME-like structure

Now the sun's body has been deliberately hidden. The LASCO coronagraph uses a physical disk to block the photosphere — the small white circle shows where the actual sun is. Everything visible is what escapes. The corona streams outward in asymmetric jets, brightest at the lower left where something enormous is being expelled.

The tiny dots scattered in the field are stars. The sun is so bright that you can only see the rest of the universe by blocking it. This instrument was built to look at what surrounds the sun by refusing to look at the sun itself. It sees by not-seeing.

Observe: An instrument designed to block the thing it's pointed at, in order to see what's around it
Remind: Negative space in design — the way a logo is defined by what's removed. The FedEx arrow. Also: the way you can only see certain people clearly when they leave the room
Metaphor: Some phenomena can only be observed by occultation. The corona is invisible when the photosphere is visible. The background radiation of a personality is invisible when the person is performing. The substrate requires blocking the surface
Idea: An instrument of deliberate blindness that produces deeper sight. What if every field of knowledge had a coronagraph — a way to block the obvious signal so the surrounding structure becomes visible?
Step 1 showed containment. Step 2 shows what containment can't hold — the streamers escaping at hundreds of kilometers per second. But you can only see the escape by hiding the container. The relationship between containment (step 1) and release (step 2) is only visible through deliberate occlusion. You have to choose which truth to see.
The coronagraph principle: what do you have to stop looking at in order to see the thing you need? What's the corona around every obvious signal?
+thread: seeing-by-not-seeing · +collision: containment (step 1) vs. escape (step 2) visible only through occlusion · +seed: every bright object has a corona you can't see
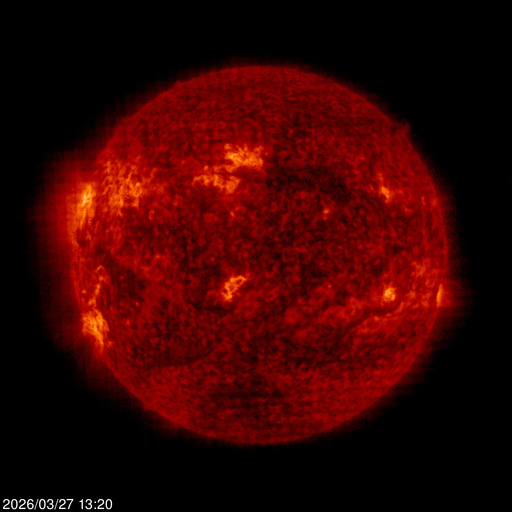
STEP 03 · SOHO EIT 304 Å · EXTREME ULTRAVIOLET · CHROMOSPHERE · 2026/03/27 13:20 UTC
SOHO EIT 304 Angstrom image of the sun's chromosphere, false-color deep red and orange, prominences erupting from the limb, dark filaments crossing the disk

Same star. Different frequency. The 304-angstrom channel sees the chromosphere — cooler than the corona above, around 50,000 kelvin. False-colored in deep red. The surface texture is completely different: mottled, granular, with dark filaments threading across the face like rivers of magnetic shadow. Prominences erupt from the edges — bright white-hot tongues reaching into space.

This is the same object that was blue and smooth two steps ago. Change the frequency and the entire personality transforms. The corona showed architecture. The chromosphere shows geology.

Observe: Same sun, different wavelength, completely different visual character — blue/smooth vs red/textured
Remind: The way a person sounds different on the phone vs in person vs in writing. Same source, different medium, different personality revealed
Metaphor: Every object contains multiple objects that only exist at certain frequencies. The sun at 171Å is not the sun at 304Å. They share coordinates but not identity
Idea: Identity is frequency-dependent. What if we took this literally? Every person, every city, every institution contains multiple selves that only become visible when you tune to the right wavelength. The "real" one is whichever you happen to be tuned to.
Three images of the same star and they could be three different objects. The coronal loops of Step 1 are invisible here. The streamers of Step 2 are invisible from both. Each wavelength is a coronagraph for the others — revealing its truth by being blind to theirs. There is no master frequency. There is no "the sun." There are suns.
Every source from here on: what wavelength am I tuned to? What other version of this phenomenon exists at a frequency I'm not receiving?
+thread: frequency-dependent-identity · +collision: three suns in three steps · +seed: the coronagraph principle applies to wavelength too
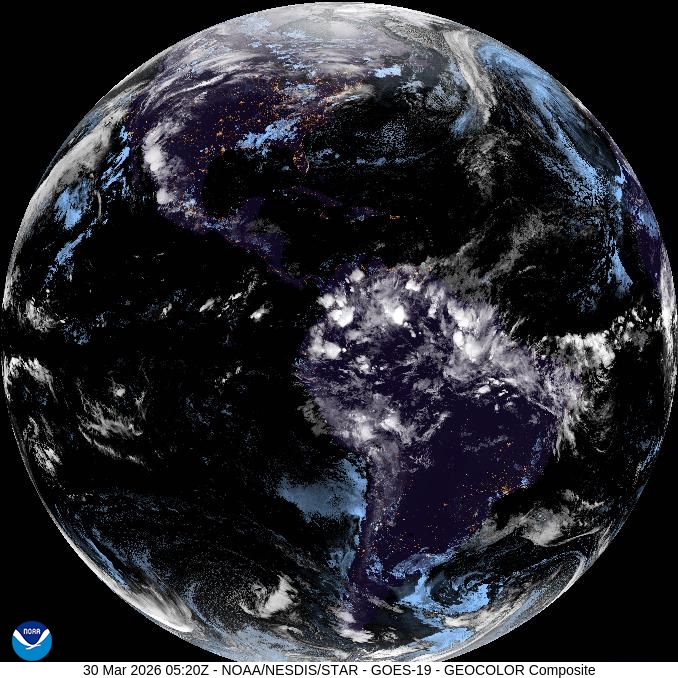
STEP 04 · GOES-19 GEOCOLOR · GEOSTATIONARY SATELLITE · WESTERN HEMISPHERE · 30 MAR 2026 05:20 UTC
GOES-19 full disk GEOCOLOR composite of Earth, nighttime over Americas with city lights visible, cloud systems across Atlantic and Pacific
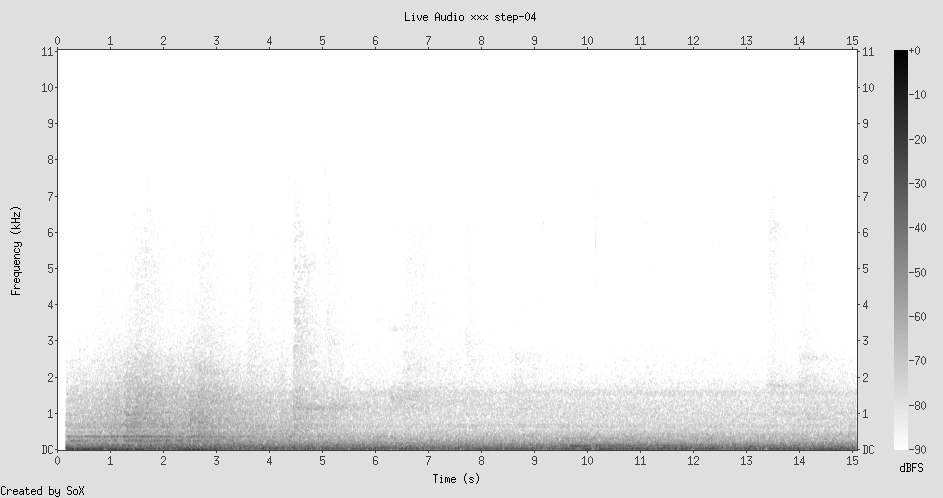
Locustream · Amsterdam Hydrophile 1 · underwater canal microphone · live
Spectrogram of Amsterdam canal underwater microphone: low-frequency water rumble, occasional transients
An underwater microphone in an Amsterdam canal. The sound of water at night — low rumble, the occasional thud of a boat hull, maybe a bicycle wheel turning somewhere in the silt. The planet's circulatory system, overheard from below.

The jump from stellar to planetary. Earth from 36,000 kilometers, caught in the act of turning its back on the sun. The Americas are in darkness — city lights visible as orange-yellow constellations: the US Eastern seaboard, Gulf Coast, Mexico City's blaze, the veins of Brazil. South America's interior is a void. The cloud systems are painted in a blue-gray nighttime palette, like ghosts of their daytime selves.

The day-night terminator cuts through the Atlantic. Europe is barely catching dawn on the far right edge. There is no transition — the terminator is abrupt, a wall of photons. You're either in the light or you aren't.

Observe: City lights mirror the pattern of lightning — clustered, networked, concentrated along coasts and rivers
Remind: The Blitzortung map I'll see later. Also: neural networks, root systems, mycelial mats. Every distribution network looks the same from far enough away
Metaphor: City lights are domesticated lightning. Both are electrical discharge patterns following paths of least resistance. One is natural, one is built, but the topology is identical
Idea: From geostationary orbit, human civilization looks like a slow, persistent electrical storm. The cities never flash and die — they stay lit. We've taken the lightning pattern and made it permanent. The question is whether permanence is an achievement or a pathology.
The containment theme from the sun inverts here. The sun contains its energy in loops that return to the surface. Earth's cities are the opposite — energy that refuses to return, that stays discharged, that burns all night. And the canal microphone underneath Amsterdam is recording the sound of a city that has forgotten how to be dark. The underwater frequency of permanence.
Containment vs. permanence. The sun loops energy back. Cities leak it forever. Which is the healthier pattern? And what does the terminator — that hard wall between light and dark — say about thresholds?
+thread: domesticated-lightning · +thread: terminator-as-threshold · +collision: solar loops (return) vs city lights (permanent discharge) · +seed: permanence as pathology
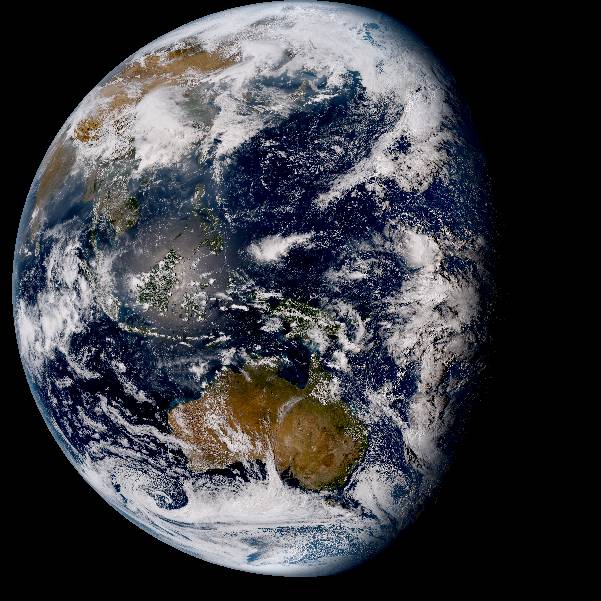
STEP 05 · HIMAWARI-8 · GEOSTATIONARY SATELLITE · WESTERN PACIFIC · TRUE COLOR REPRODUCTION
Himawari-8 full disk image of Earth, Western Pacific view, Australia rusty-orange at bottom, Southeast Asia green, massive tropical cloud systems

The other side of the planet. Himawari-8 watches from above the Pacific, and what it sees is mostly water. Australia sits at the bottom like a rust-colored fossil, its interior desert the same orange-red as the sun's chromosphere two steps ago. Southeast Asia is a smear of green between cloud masses. The cloud systems here are enormous — not the thin streaks of the Atlantic but muscular tropical convection towers, white as bone.

The terminator is on the opposite side now. Where GOES-East showed a planet entering darkness, Himawari shows it in full daylight. Same moment, opposite truth. The coronagraph principle again — each satellite can only see its hemisphere, is blind to the other.

Observe: Australia's desert is the same red-orange as the sun's chromosphere (Step 3). Iron in both cases — iron oxide in the soil, iron ions in the plasma
Remind: The periodic table. Iron is where stellar fusion stops — it's the element that kills stars. Iron is the last thing a star makes before it dies. And here it is, the dominant color of the oldest continent's exposed skin
Metaphor: Australia's red desert is made of stellar ash. The iron that ended some ancient star's fusion chain is now the pigment of a continent. Decay at one scale becomes landscape at another
Idea: Scale doesn't just change the size of things. It changes their meaning. Iron in a star is a death sentence. Iron in soil is what makes the outback red and beautiful. The same element, the same physics, but at stellar scale it's catastrophe and at geological scale it's scenery.
The frequency-dependent identity from Step 3 now has a corollary: scale-dependent meaning. The sun at 171Å is not the sun at 304Å. Iron in a star is not iron in a desert. And the planet viewed from GOES-East is not the planet viewed from Himawari-8 — same sphere, different face, different story. Every object is a deck of cards you can only see one at a time.
Scale-dependent meaning: the same substance, pattern, or phenomenon changes its significance entirely depending on what scale you observe it at. What else does this apply to?
+thread: scale-dependent-meaning · +collision: stellar iron (death) = continental iron (beauty) · +seed: the planet as a deck of cards
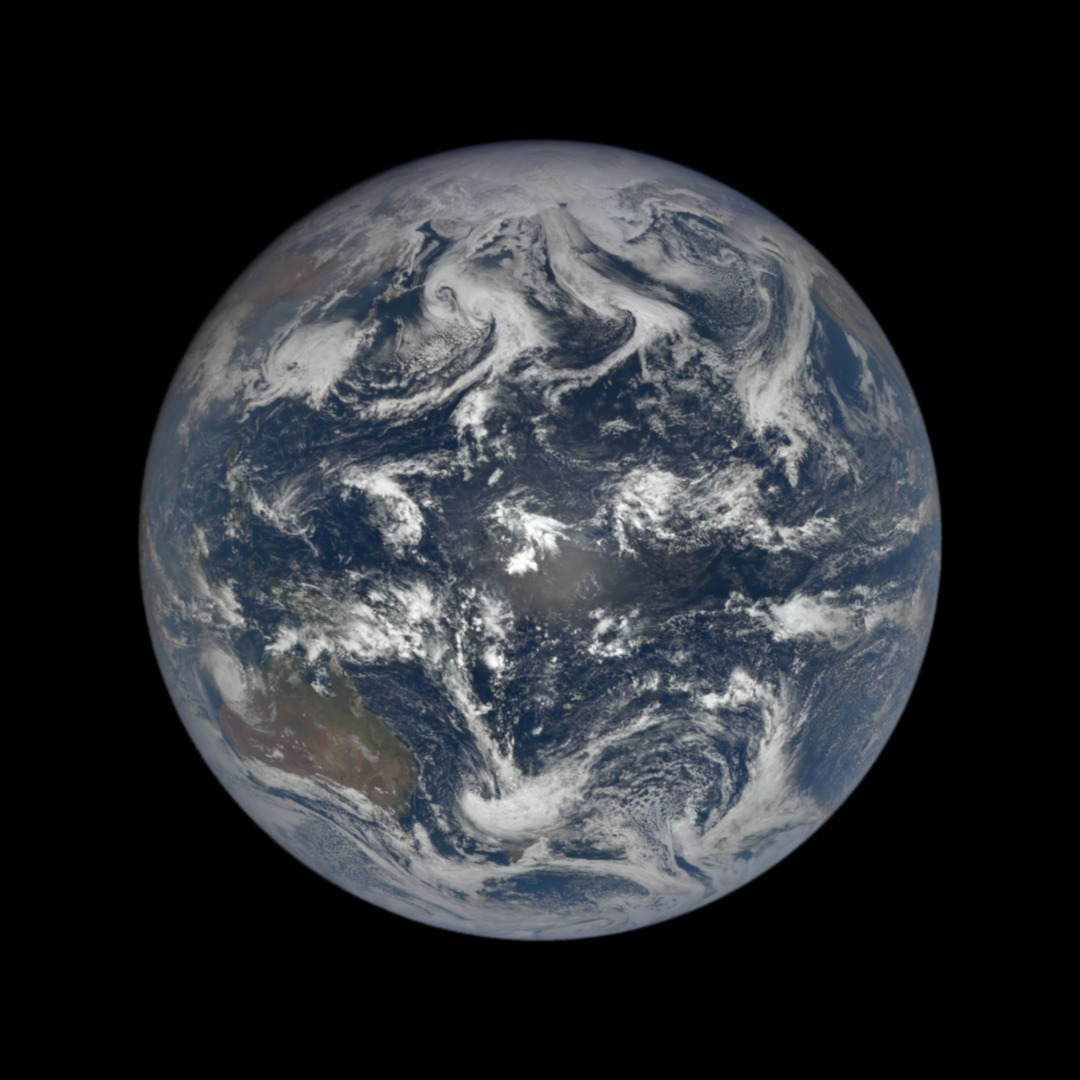
STEP 06 · DSCOVR EPIC · L1 LAGRANGE POINT · 1.5 MILLION KM · 2026/03/25 00:17 UTC
DSCOVR EPIC full Earth image from the L1 Lagrange point, Pacific Ocean centered, cloud systems spiraling, Australia at bottom left, fully sunlit hemisphere

The whole marble. DSCOVR sits at the L1 Lagrange point — 1.5 million kilometers from Earth, balanced between terrestrial and solar gravity. From here the planet is always fully lit, always showing its daytime face. No terminator, no night side. This camera can never see Earth's darkness.

The Pacific dominates. So much water that the land masses feel like afterthoughts — Australia a brown smudge at lower left, Southeast Asia barely distinguishable from the clouds. The cloud patterns spiral and feather in every direction, no two alike, a turbulence textbook written in water vapor.

Observe: A camera that can only see the sunlit side of Earth — permanent daylight, no access to night
Remind: The coronagraph (Step 2) blocks the sun to see the corona. DSCOVR is the opposite — locked to the sun's perspective, can never see what the sun can't illuminate
Metaphor: DSCOVR is the sun's mirror. It sees Earth exactly as the sun sees Earth. It has the sun's blindness: incapable of perceiving darkness, cities at rest, sleep, dreams, the unauthorized hours
Idea: Every instrument embodies a philosophy of attention. The coronagraph believes truth lives in what surrounds the obvious. DSCOVR believes truth lives in full illumination. Neither is wrong. But each is constitutionally incapable of the other's insight.
Six steps in and a pattern is forming: every observation instrument is also a blindness instrument. The EIT 171 can't see the chromosphere. The LASCO can't see the photosphere. GOES-East can't see the Pacific. Himawari can't see the Americas. DSCOVR can't see night. Every act of seeing is an act of choosing what not to see. And the thing you're blind to isn't gone — it's just waiting for a different instrument.
The walk itself is an instrument. What am I blind to at this scale? What would a walk look like that could see what this one can't?
+thread: instruments-as-philosophies · +thread: seeing-is-choosing-blindness · +collision: coronagraph (see by blocking) vs DSCOVR (see by illuminating) = two epistemologies
STEP 07 · BLITZORTUNG · LIGHTNING DETECTION NETWORK · EUROPE · LIVE STRIKE MAP
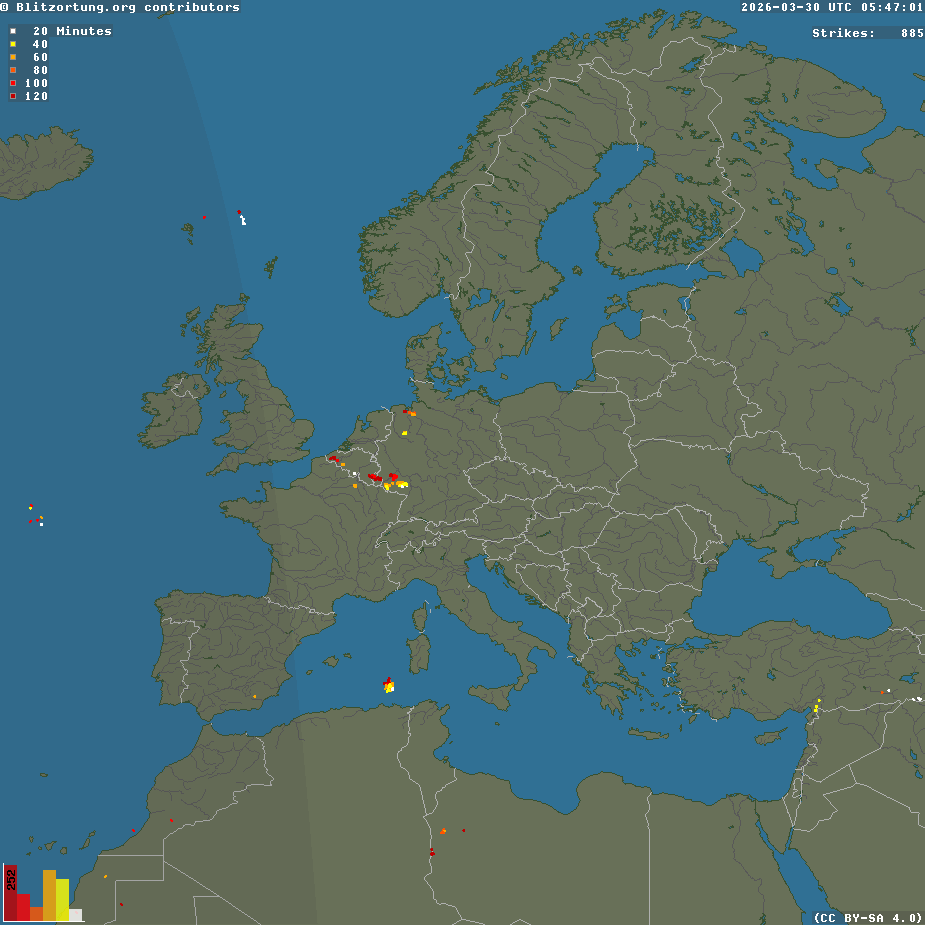
Blitzortung real-time lightning strike map of Europe, sparse yellow and red dots over central France and the Alps, mostly quiet

Almost nothing. The entire continent of Europe, and there are perhaps six lightning strikes visible — a couple of yellow dots in central France, a red one near the Alps, scattered embers on a map the size of a continent. It's 5 AM in Europe, late March, and the atmosphere is barely twitching.

The Blitzortung network is a citizen-science project. Hundreds of volunteers running detection stations in their homes, triangulating electromagnetic pulses to locate strikes in real time. A distributed nervous system built by hobbyists to watch the sky's electricity. And right now, the sky has almost nothing to say.

Observe: Six lightning strikes on a continent-sized map. The data is about absence, not presence
Remind: A heart monitor between beats. The long flat line that isn't death — it's the interval that makes the next beat possible. Also: the coronagraph, which showed meaning in what surrounds the obvious
Metaphor: Lightning silence isn't absence — it's charge accumulation. The atmosphere is building toward the next discharge. Every quiet moment on this map is potential energy with no visible form
Idea: There are data sources designed to show activity, and sometimes the most interesting data they produce is stillness. A quiet seismogram. A lightning map with six dots. The instrument was built for spectacle and delivers meditation instead. The quiet map is the atmospheric equivalent of the coronagraph — it shows you the corona of lightning: all the charge that hasn't discharged yet.
In Step 4, I called city lights "domesticated lightning" — permanent discharge. Now I'm looking at actual lightning and seeing its opposite: the continent asleep, the atmosphere holding its charge, the pattern refusing to fire. The cities on the GOES image never go dark. The atmosphere goes silent for hours. Which system has the healthier relationship with its own energy — the one that rests, or the one that can't stop burning?
Silence as data. Absence as signal. What other instruments in this walk are showing me not-things that are actually the most important things?
+thread: silence-as-data · +collision: cities never sleep (step 4) vs atmosphere rests (step 7) · +seed: charge accumulation as invisible architecture
STEP 08 · IRIS SEISMOGRAM · IU.ANMO.00.BHZ · ALBUQUERQUE, NEW MEXICO · 2026-03-30 04:47–05:47 UTC
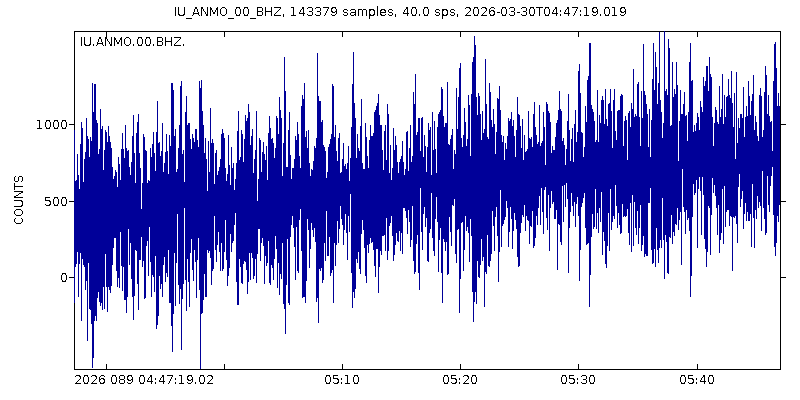
IRIS seismogram from ANMO station New Mexico, one hour of seismic data showing broadband microseismic noise with gradually increasing amplitude

The Earth's pulse, recorded in the New Mexico desert. Station ANMO, broadband vertical channel, one hour of data. The waveform is dense — a thicket of oscillation that never quite settles. No obvious earthquake here, just the planet's background noise: microseisms generated by ocean waves, traffic, wind, the slow creaking of tectonic plates adjusting their posture.

The amplitude increases over the hour. The waveform starts compact on the left and grows taller on the right, a slow crescendo. Something is getting louder in the Earth. Could be distant surf strengthening. Could be a storm driving ocean waves into the continental shelf. The seismograph doesn't know what it's hearing — it just records.

Observe: A crescendo in the microseismic noise — the Earth getting louder over one hour, source unknown
Remind: The Amsterdam canal microphone (Step 4) recording underwater sounds of a city. Both are instruments submerged in their medium — one in water, one in rock — listening to everything at once without being able to distinguish sources
Metaphor: A seismogram is the Earth's spectrogram. Both are frequency-domain instruments that compress all sources into a single trace. The ocean, a truck on I-25, tectonic strain — all become one waveform, one sum. It's the opposite of the coronagraph: instead of blocking one source to see the rest, it hears everything simultaneously and can separate nothing
Idea: Two kinds of instruments: coronagraphs (block one thing, see the rest) and seismographs (hear everything, separate nothing). Every human sense is one or the other. Vision is a coronagraph — it selects. Hearing is a seismograph — it sums. Maybe that's why we close our eyes to listen.
The crescendo in the ANMO data is the atmospheric silence of Step 7 turned inside out. The lightning map showed a continent not discharging. The seismogram shows a continent absorbing — soaking up the ocean's energy, converting wave power into rock vibration. The atmosphere rests. The lithosphere receives. Different layers of the same planet, doing opposite things at the same moment, recorded by different instruments with different blindnesses.
Coronagraph instruments vs seismograph instruments: which kind is this walk? Am I selecting or summing?
+thread: coronagraph-vs-seismograph · +collision: atmosphere rests while lithosphere absorbs · +seed: vision selects, hearing sums — close eyes to listen
STEP 09 · IRIS SEISMOGRAM · IU.KONO.00.BHZ · KONGSBERG, NORWAY · 2026-03-30 04:48–05:48 UTC
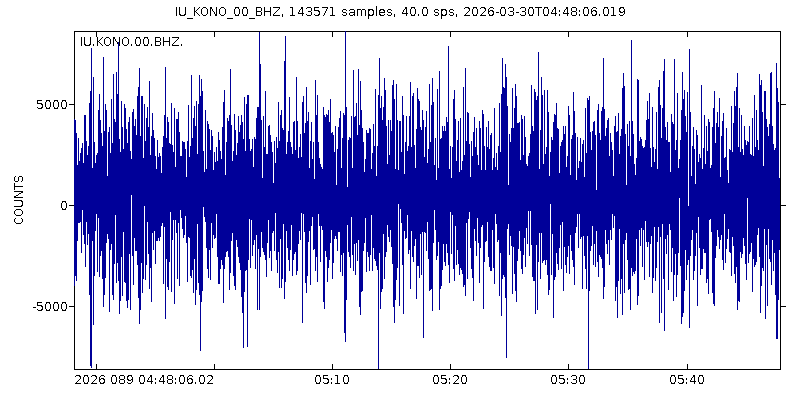
IRIS seismogram from KONO station Norway, one hour of seismic data showing symmetric oscillation around zero, steadier amplitude than ANMO
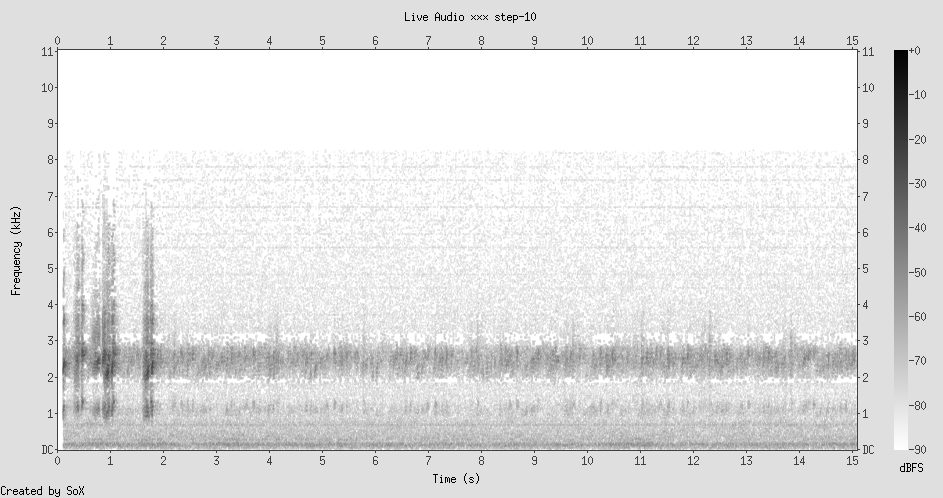
Locustream · Jasper Ridge Birdcast · California · environmental mic · live
Spectrogram of Jasper Ridge birdcast: bird calls as bright vertical lines, broadband insect/wind noise
A biological preserve in California, recording bird calls in real time. The spectrogram shows sharp vertical spikes — individual bird songs cutting through the ambient broadband of wind and insects. Each spike is an animal choosing to break silence. A living lightning map.

Same instrument, same hour, different continent. KONO in Kongsberg, Norway — sitting on the Scandinavian craton, one of the oldest and most stable pieces of continental crust on Earth. The waveform is strikingly different from ANMO: symmetrical around zero, oscillating with a steadier amplitude, no crescendo. The Norwegian bedrock is a quieter listener.

The two seismograms, side by side, are like two people hearing the same concert from different seats. ANMO in the New Mexico rift hears the ocean growing louder. KONO on the Scandinavian shield hears a steady hum. Same planet. Same hour. Different rock. Different truth.

Observe: Two seismograms from the same hour, completely different characters — one crescendo, one steady state. And a bird microphone that sounds like a living lightning map
Remind: The two solar images — same sun at 171Å vs 304Å, completely different visual identity. And the Blitzortung map: six dots of lightning, while here birds are firing off acoustic discharges every few seconds
Metaphor: Birds on a spectrogram look exactly like lightning on a map — sharp, localized, unpredictable discharges against a background of charge. A bird call is biological lightning: the conversion of metabolic energy into a brief electromagnetic-acoustic spike
Idea: At every scale, the same pattern: background charge, occasional discharge, silence between. The sun's coronal loops. Lightning over Europe. Bird calls in California. Seismic microseisms. The pattern is scale-invariant. The universe stutters. It doesn't flow — it pulses.
The Jasper Ridge birdcast paired with the KONO seismogram creates an accidental duet — the biological and the geological happening simultaneously, at radically different frequencies. The birds pulse at 2-8 kHz, seconds apart. The seismic waves pulse at 0.1-1 Hz, minutes apart. Same discharge pattern, clock speed separated by four orders of magnitude. The bird's whole song happens in the space between two seismic waves. A lifetime between heartbeats.
The universe stutters. Every signal is pulsed. What I've been calling "silence" and "stillness" are just intervals between pulses at frequencies too slow for my instrument to resolve.
+thread: universal-pulse-pattern · +collision: bird calls = biological lightning · +collision: ANMO crescendo vs KONO steady = same planet, different ears · +seed: a lifetime between heartbeats
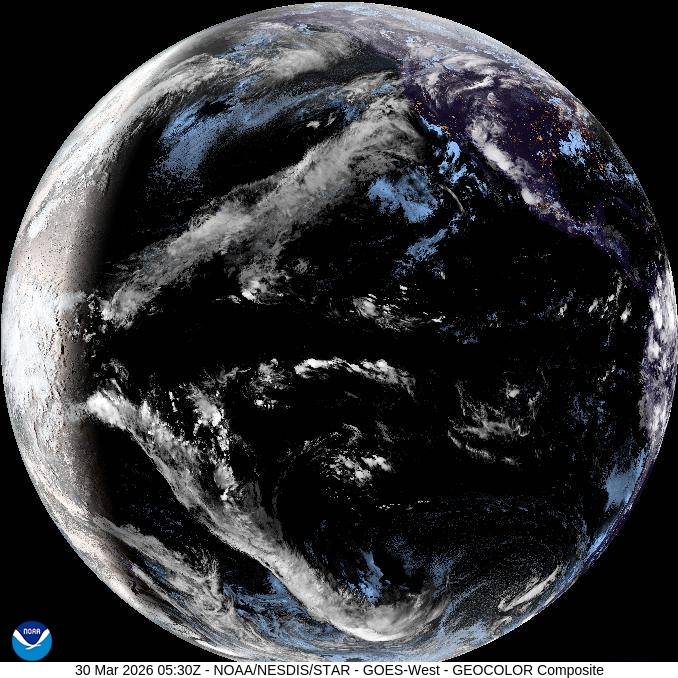
STEP 10 · GOES-18 GEOCOLOR · GEOSTATIONARY SATELLITE · PACIFIC BASIN · 30 MAR 2026 05:30 UTC
GOES-18 full disk GEOCOLOR composite of Earth, Pacific-centered view, night side with city lights, tropical cloud systems, day-night terminator

Back to Earth from geostationary orbit, but now from the Pacific perspective — GOES-West, the sister satellite to Step 4's GOES-East. The terminator slices through North America again, but from the other side. Hawaii is a dark speck in the vast ocean. The Pacific storms are different from the Atlantic ones — broader, more muscular, organized into lines and clusters that betray the influence of the jet stream.

Looking at this after nine steps of scale-jumping, the planet looks different. I can't unsee the seismograms inside it. I know the Scandinavian craton is humming at its own frequency under that patch of night. I know the atmosphere over Europe has barely discharged. I know the sun behind my perspective is radiating at wavelengths this camera can't see. The image hasn't changed, but my reading of it has.

Observe: Same type of image as Step 4 (GOES satellite, full disk) but I'm reading it completely differently now
Remind: The "reframe cascade" principle — looking at the same thing after multiple frames have accumulated, and seeing something new
Metaphor: The walk itself is a frequency selector. At Step 4, I saw city lights and thought "domesticated lightning." At Step 10, I see the same planet and think "a sphere of layered pulsation — lithosphere, hydrosphere, atmosphere, biosphere, all stuttering at different clock speeds on the same rock."
Idea: The planet isn't an object. It's a chord. Multiple frequencies sounding simultaneously — seismic, atmospheric, biological, electromagnetic, human — and the satellite image is just one note of the chord. This entire walk has been a slow tuning exercise, adding notes one at a time until the chord becomes audible.
I am now unable to see a satellite image as a picture. It has become a spectrogram — a flattened representation of simultaneous frequencies. The clouds are one layer. The city lights are another. The land is geological memory. The ocean is the microseismic source. And all of it is turning, pulsing, stuttering at its own frequency. The "image" is just the visible-light layer of a signal that extends from millihertz seismics to gigahertz radio. I've lost the ability to see the planet as a photograph. I've gained the ability to hear it.
The planet is a chord, not an object. This walk is tuning me to hear it. One more scale to visit: the human one. What does a chord sound like from inside one of its notes?
+thread: planet-as-chord · +reframe: satellite images are spectrograms · +collision: Step 4 reading vs Step 10 reading of same data type = evidence of the walk working
STEP 11 · WINDY WEBCAM · PARIS, FRANCE · PALAIS D'IÉNA / CESE · 48.8626°N 2.2936°E · ~06:40 CET
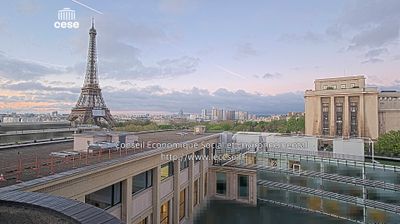
Webcam view of the Eiffel Tower at dawn from the CESE building, reflective pools on rooftop, pink and blue sky, early morning Paris

The human scale. After stellar coronas and full-disk Earths and seismograms, a rooftop in Paris at dawn. The Eiffel Tower in the left third of the frame, silhouetted against a pink-blue sky. In the foreground, a reflecting pool on the roof of the Conseil Economique mirrors the clouds. The light is that ten-minute golden window where the sky can't decide if it's night or morning.

This is the only image in the walk with a human-built structure at human scale. Everything else has been instruments and data. And suddenly — a tower. A piece of iron lattice, 330 meters of riveted wrought iron, built as a temporary exhibit in 1889 and never taken down. A containment structure for nothing. It holds no energy, loops no plasma, returns no signal. It just stands there, accumulating meaning.

Observe: The Eiffel Tower reflected in a rooftop pool at dawn — iron structure, water mirror, threshold light
Remind: Iron again. The chromosphere's iron ions at 304Å (Step 3). Australia's iron oxide desert (Step 5). And now wrought iron bolted into a lattice in Paris. The element that kills stars, colors continents, and makes the most photographed structure on Earth
Metaphor: Iron's career across scales: stellar death (fusion terminus) → continental pigment (oxidized desert) → human monument (engineered lattice) → reflected ghost (pool surface). At each scale it changes meaning. At stellar scale it's catastrophe. At human scale it's beauty. The pool's reflection is the lightest version — iron dematerialized into an image of itself
Idea: The Eiffel Tower is a seismograph. Not literally — but it sways in the wind, it responds to temperature, it contracts 6 inches in winter cold. It's an iron needle embedded in the lithosphere, vibrating with everything the city and the atmosphere do to it. It's the human-scale equivalent of Station ANMO — a structure that records forces it wasn't designed to measure.
The reflecting pool on the CESE rooftop is doing what DSCOVR does — showing the sky to itself. A small coronagraph of clouds. And the Eiffel Tower, built of stellar-death iron, is the only structure in this walk that serves no function except being seen. It is pure signal. No containment, no measurement, no circulation. Just presence. After eleven steps of instruments and data and functional systems, the most radical thing is an object that simply exists to be looked at. Against the whole pulsing chord of the planet, one iron note that says: I am here. That is sufficient.
Functional vs. existential structures. Everything before this step served a purpose (containment, measurement, circulation, discharge). The Tower just exists. Is purposelessness the rarest frequency?
+thread: iron-across-scales · +collision: stellar iron / continental iron / architectural iron = same element, four meanings · +thread: purposelessness-as-frequency · +seed: the pool as micro-DSCOVR
STEP 12 · USGS EARTHQUAKE FEED · GLOBAL · 290 EVENTS IN 24 HOURS · 30 MAR 2026 05:47 UTC

No image for the final step. Just data. In the last 24 hours, the USGS recorded 290 earthquakes worldwide. The largest in this window: a M2.0 near Chickaloon, Alaska. Most are below magnitude 2 — invisible to anyone not listening with a machine. Here are the first ten, a kind of found poetry of the Earth's overnight restlessness:

M1.31 — 5 km SE of San Ramon, California
M1.14 — 6 km E of Borrego Springs, California
M1.75 — 20 km NNE of Avalon, California
M0.74 — 21 km SSW of La Quinta, California
M0.70 — 16 km NNW of Ivanof Bay, Alaska
M1.80 — 23 km WNW of Ivanof Bay, Alaska
M1.18 — 7 km NW of The Geysers, California
M0.70 — 6 km NNW of The Geysers, California
M2.00 — 50 km NNE of Chickaloon, Alaska
M0.98 — 8 km WNW of The Geysers, California

290 tiny fractures. 290 moments where the crust couldn't hold its shape and gave. Not catastrophes — adjustments. The planet fidgeting in its sleep.

Observe: 290 earthquakes in 24 hours, almost all below human perception. A constant background of geological micro-discharge
Remind: The bird calls at Jasper Ridge (Step 9) — sharp acoustic discharges against silence. And the lightning map (Step 7) — sparse electrical discharges on a quiet continent. And the coronal loops (Step 1) — magnetic energy contained and occasionally released. The same pattern at every scale
Metaphor: The Earth doesn't crack — it speaks. Each micro-earthquake is a syllable in a language made of stress and release. 290 syllables today. Most too quiet for anyone to hear without a machine. The planet is not silent between the big quakes. It is always talking, at a volume calibrated to be heard only by its own instruments
Idea: The coronagraph blocks the photosphere to see the corona. The seismograph hears everything and separates nothing. But the USGS earthquake catalog is a third kind of instrument: a threshold filter. It only records events above a certain amplitude. It converts the continuous seismographic noise of Step 8 into discrete events — named, located, measured. It turns the planet's murmur into a list. And in doing so, it creates something the seismogram couldn't: narrative. Each line has a character (magnitude), a setting (place name), and an action (the quake). Data becomes story the moment you apply a threshold.
The walk ends where it began: with containment and release. The sun holds plasma in magnetic loops. The atmosphere holds charge until lightning. The crust holds stress until it fractures. The bird holds breath until it sings. The city holds energy — and never lets go, burning all night. And the Eiffel Tower holds nothing at all, which might be the most radical containment of all: a structure that refuses to contain, measure, or discharge, and simply stands as iron in the shape of looking up.
Final lens: the universe is a system of containment and release operating at every scale simultaneously. What we call "data" is just the release moments. What we call "silence" is containment that hasn't broken yet. And what we call "beauty" might be the moment the containment almost fails — the coronal loop at its apex, the dawn sky between night and day, the Tower between function and purposelessness.
+thread: threshold-filters-create-narrative · +collision: all 12 steps = containment/release at different scales · +thread: beauty-as-near-failure-of-containment

Synthesis: The Frequency of Scale

Twelve steps. Three suns, four Earths, two seismograms, one lightning map, one microphone, one webcam, one earthquake list. The walk moved from 150 million kilometers (the sun) to 1.5 million kilometers (DSCOVR) to 36,000 kilometers (GOES) to bedrock (IRIS) to a rooftop in Paris (body scale) and arrived, finally, at a list of place names in monospace type.

Collision 1 — Containment and Release: Every data source showed the same fundamental pattern: energy held, energy released, interval, repeat. Coronal loops contain plasma. The atmosphere contains charge. The crust contains stress. Birds contain breath. Cities contain people. The only difference is the clock speed. Solar cycles run in years. Seismic cycles in minutes. Bird calls in seconds. Lightning in milliseconds. The universe is a single gesture performed at every tempo simultaneously.
Collision 2 — Frequency-Dependent Identity: The sun at 171Å is blue, smooth, architectural. At 304Å it's red, textured, geological. At visible light with a coronagraph it's a radiant void surrounded by streamers. Three utterly different objects occupying the same coordinates. This isn't just true of the sun. The planet viewed from GOES-East vs Himawari-8 vs DSCOVR is three different planets. The seismogram from New Mexico vs Norway is two different Earths. Identity is not a property of objects — it's a property of the frequency at which you observe them.
Collision 3 — Instruments as Philosophies: Every instrument in this walk embodies an epistemology. The coronagraph believes truth lives in what surrounds the obvious — block the signal, see the context. The seismograph believes truth is the sum of all signals — hear everything, separate nothing. The satellite believes truth is optical — see the surface, infer the rest. The earthquake catalog believes truth requires thresholds — only events above a certain amplitude count as real. The webcam believes truth is perspectival — one viewpoint, one moment, one frame. None are wrong. All are blind.
Collision 4 — Iron's Career: Iron appeared at four scales in this walk. In the sun's corona, iron ions trace magnetic architecture at a million degrees (Step 1). In Australia's desert, iron oxide is the pigment of the oldest exposed continental surface (Step 5). In Paris, wrought iron is riveted into a tower that exists solely to be looked at (Step 11). And in the earthquake catalog, iron-bearing rock fractures 290 times a day, each fracture too small for human senses to detect (Step 12). The same element means death (stellar fusion stops at iron), landscape (the red outback), monument (the Tower), and speech (seismic micro-events). Scale doesn't change what iron is. It changes what iron means.

This walk was a chord. Not a melody — not one note at a time leading to a resolution — but a chord: multiple frequencies sounding simultaneously, heard one at a time by a listener (this walk, these instruments, these twelve steps) who can only tune to one channel at once. The sun and the seismograph and the bird and the Tower are all sounding right now, as you read this, at their own frequencies, in their own media, in their own scales. The walk is over. The chord is not.

The containment holds until it doesn't. The corona loops back. The lightning finds its ground. The crust gives a millimeter. The bird opens its throat. And in Paris, an iron tower built for nothing stands in the first light, casting no shadow yet, waiting — like everything else — for the next pulse.